|
Miltenyi Biotec
rat anti mouse cd43 magnetic beads Rat Anti Mouse Cd43 Magnetic Beads, supplied by Miltenyi Biotec, used in various techniques. Bioz Stars score: 91/100, based on 1 PubMed citations. ZERO BIAS - scores, article reviews, protocol conditions and more https://www.bioz.com/result/rat anti mouse cd43 magnetic beads/product/Miltenyi Biotec Average 91 stars, based on 1 article reviews
rat anti mouse cd43 magnetic beads - by Bioz Stars,
2026-03
91/100 stars
|
Buy from Supplier |
|
Miltenyi Biotec
cd43 fo b cells Cd43 Fo B Cells, supplied by Miltenyi Biotec, used in various techniques. Bioz Stars score: 97/100, based on 1 PubMed citations. ZERO BIAS - scores, article reviews, protocol conditions and more https://www.bioz.com/result/cd43 fo b cells/product/Miltenyi Biotec Average 97 stars, based on 1 article reviews
cd43 fo b cells - by Bioz Stars,
2026-03
97/100 stars
|
Buy from Supplier |
|
Bio-Rad
w3 13 W3 13, supplied by Bio-Rad, used in various techniques. Bioz Stars score: 93/100, based on 1 PubMed citations. ZERO BIAS - scores, article reviews, protocol conditions and more https://www.bioz.com/result/w3 13/product/Bio-Rad Average 93 stars, based on 1 article reviews
w3 13 - by Bioz Stars,
2026-03
93/100 stars
|
Buy from Supplier |
|
Miltenyi Biotec
anti-mouse anti cd43-ly48 Anti Mouse Anti Cd43 Ly48, supplied by Miltenyi Biotec, used in various techniques. Bioz Stars score: 91/100, based on 1 PubMed citations. ZERO BIAS - scores, article reviews, protocol conditions and more https://www.bioz.com/result/anti-mouse anti cd43-ly48/product/Miltenyi Biotec Average 91 stars, based on 1 article reviews
anti-mouse anti cd43-ly48 - by Bioz Stars,
2026-03
91/100 stars
|
Buy from Supplier |
|
Miltenyi Biotec
cd43 antibody conjugated with apc  Cd43 Antibody Conjugated With Apc, supplied by Miltenyi Biotec, used in various techniques. Bioz Stars score: 91/100, based on 1 PubMed citations. ZERO BIAS - scores, article reviews, protocol conditions and more https://www.bioz.com/result/cd43 antibody conjugated with apc/product/Miltenyi Biotec Average 91 stars, based on 1 article reviews
cd43 antibody conjugated with apc - by Bioz Stars,
2026-03
91/100 stars
|
Buy from Supplier |
|
Miltenyi Biotec
cd43 pe 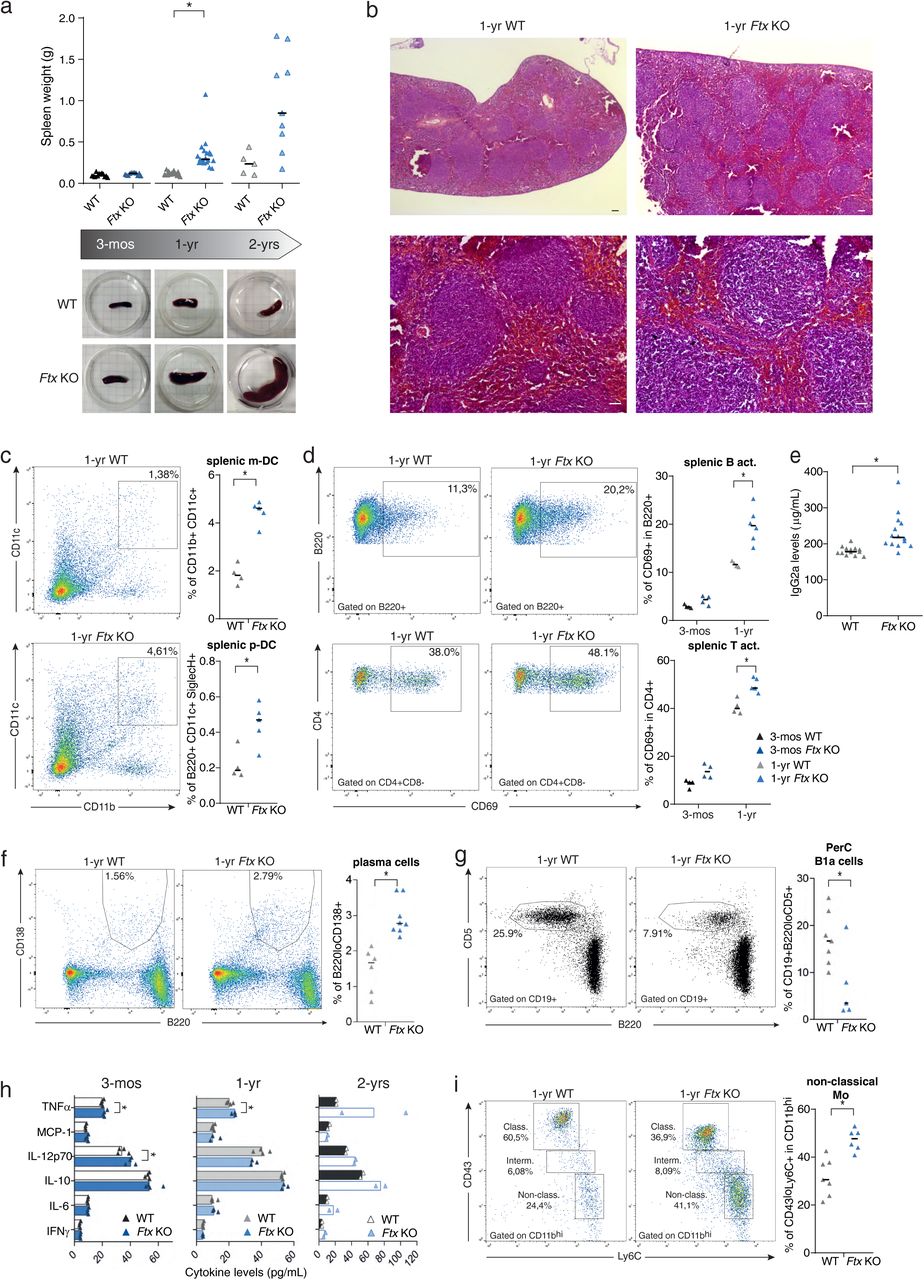 Cd43 Pe, supplied by Miltenyi Biotec, used in various techniques. Bioz Stars score: 93/100, based on 1 PubMed citations. ZERO BIAS - scores, article reviews, protocol conditions and more https://www.bioz.com/result/cd43 pe/product/Miltenyi Biotec Average 93 stars, based on 1 article reviews
cd43 pe - by Bioz Stars,
2026-03
93/100 stars
|
Buy from Supplier |
|
Bio-Rad
cd43  Cd43, supplied by Bio-Rad, used in various techniques. Bioz Stars score: 90/100, based on 1 PubMed citations. ZERO BIAS - scores, article reviews, protocol conditions and more https://www.bioz.com/result/cd43/product/Bio-Rad Average 90 stars, based on 1 article reviews
cd43 - by Bioz Stars,
2026-03
90/100 stars
|
Buy from Supplier |
|
Bio-Rad
rat anti mouse cd43 monoclonal antibody Rat Anti Mouse Cd43 Monoclonal Antibody, supplied by Bio-Rad, used in various techniques. Bioz Stars score: 93/100, based on 1 PubMed citations. ZERO BIAS - scores, article reviews, protocol conditions and more https://www.bioz.com/result/rat anti mouse cd43 monoclonal antibody/product/Bio-Rad Average 93 stars, based on 1 article reviews
rat anti mouse cd43 monoclonal antibody - by Bioz Stars,
2026-03
93/100 stars
|
Buy from Supplier |
|
fluidigm
3146009c  3146009c, supplied by fluidigm, used in various techniques. Bioz Stars score: 93/100, based on 1 PubMed citations. ZERO BIAS - scores, article reviews, protocol conditions and more https://www.bioz.com/result/3146009c/product/fluidigm Average 93 stars, based on 1 article reviews
3146009c - by Bioz Stars,
2026-03
93/100 stars
|
Buy from Supplier |
|
Bio-Rad
mouse anti cd43 Mouse Anti Cd43, supplied by Bio-Rad, used in various techniques. Bioz Stars score: 88/100, based on 1 PubMed citations. ZERO BIAS - scores, article reviews, protocol conditions and more https://www.bioz.com/result/mouse anti cd43/product/Bio-Rad Average 88 stars, based on 1 article reviews
mouse anti cd43 - by Bioz Stars,
2026-03
88/100 stars
|
Buy from Supplier |
|
Miltenyi Biotec
cd43 fitc antibodies Cd43 Fitc Antibodies, supplied by Miltenyi Biotec, used in various techniques. Bioz Stars score: 91/100, based on 1 PubMed citations. ZERO BIAS - scores, article reviews, protocol conditions and more https://www.bioz.com/result/cd43 fitc antibodies/product/Miltenyi Biotec Average 91 stars, based on 1 article reviews
cd43 fitc antibodies - by Bioz Stars,
2026-03
91/100 stars
|
Buy from Supplier |
|
Serotech Inc
primary mouse anti-rat cd43 antibody mca54r Primary Mouse Anti Rat Cd43 Antibody Mca54r, supplied by Serotech Inc, used in various techniques. Bioz Stars score: 90/100, based on 1 PubMed citations. ZERO BIAS - scores, article reviews, protocol conditions and more https://www.bioz.com/result/primary mouse anti-rat cd43 antibody mca54r/product/Serotech Inc Average 90 stars, based on 1 article reviews
primary mouse anti-rat cd43 antibody mca54r - by Bioz Stars,
2026-03
90/100 stars
|
Buy from Supplier |
Image Search Results
Journal: Nucleic Acids Research
Article Title: Multimode drug inducible CRISPR/Cas9 devices for transcriptional activation and genome editing
doi: 10.1093/nar/gkx1222
Figure Lengend Snippet: Design, optimization and cross-comparison of HIT transcription activation systems. ( A–C ) Cartoons illuminating the mechanisms of optimized 4-OHT induced transcription activation using a direct fusion HIT construct (A), the HIT-SAM system (B), and the HIT-SunTag system (C). ( D–I ) Cross-comparison among three optimized HIT transcription activation systems. Transcription activation induced by HIT constructs was examined in the luciferase reporter assay (D), by quantification of relative mRNA level of endogenous expression for Klf4 (E) and Oct4 (F), and by flow-cytometry analyses of CD43 protein level on the cell surface (G–I). Representative plots (G) and quantitative analyses of median CD43 fluorescent intensities (H) and overall CD43 fluorescent intensities (I) of CD43+GFP+ positive population were shown. GFP fluorescence indicates successful transfection. Cells transfected with the same amount of reporter construct or sgRNA only while keeping the total amount of transfection constant were used as negative controls (NC) in the luciferase reporter assay. Cells transfected with an ER T2 tagged GFP construct while keeping the total amount of transfection constant were used as negative control (NC) in qRT-PCR assays. Cells transfected with an unrelated sgRNA (ctl sgRNA) and GFP were used as negative control (NC) in flow-cytometry analyses. Data showed mean ± SD. n = 3 biological replicates. ns: non-significant;* P < 0.05; ** P < 0.01; *** P < 0.001; two tailed t -tests. Three biological replicates means three independently transfected samples throughout this study. The readouts without drug induction were compared in t-tests against the negative controls (NCs) for background detection.
Article Snippet: As for the CD43 activation assay, 48 h after 4-OHT was added, live cells were collected and incubated with a
Techniques: Comparison, Activation Assay, Construct, Luciferase, Reporter Assay, Expressing, Flow Cytometry, Fluorescence, Transfection, Negative Control, Quantitative RT-PCR, Two Tailed Test

Journal: Nucleic Acids Research
Article Title: Multimode drug inducible CRISPR/Cas9 devices for transcriptional activation and genome editing
doi: 10.1093/nar/gkx1222
Figure Lengend Snippet: HIT2: one CRISPR/Cas9 device for simultaneous genome editing and transcriptional activation in a drug inducible manner. ( A ) Cartoon illuminating the mechanism of the optimized drug inducible HIT2 system for simultaneous genome editing and transcriptional activation. ( B ) Simultaneous editing and activation by HIT2 and Cas9–NLS–GCN4 were examined using flow-cytometry. The percentage of GFP positive cells indicated HDR efficiency, while CD43 protein level on the cell surface represented transcription activation. Representative plots (upper panels) and quantitative analyses (lower panels) were shown. Data showed mean ± SD. n = 3 biological replicates. ns: non-significant;* P < 0.05; *** P < 0.001; **** P < 0.0001; two-tailed t -tests.
Article Snippet: As for the CD43 activation assay, 48 h after 4-OHT was added, live cells were collected and incubated with a
Techniques: CRISPR, Activation Assay, Flow Cytometry, Two Tailed Test

Journal: Nucleic Acids Research
Article Title: Multimode drug inducible CRISPR/Cas9 devices for transcriptional activation and genome editing
doi: 10.1093/nar/gkx1222
Figure Lengend Snippet: Comparisons of HIT systems with existing drug inducible designs. ( A–D ) Drug inducible efficiency and background activity of transcription activation was examined head-to-head between HIT systems and existing designs using the luciferase reporter assay (A), in which the expression of luciferase was controlled by a sgRNA target sequence (gLuc sgRNA), and the CD43 activation assay (B-D).Representative plots (B), quantitative analyses of the percentage of CD43 positive cells (C), and median CD43 fluorescent intensities (D) were shown. ( E ) Drug inducible efficiency and background activity of genome editing was examined using the FCR assay in comparison with existing designs. Representative plots (top) and quantifications (right bottom) were shown. NC, cells transfected with an unrelated sgRNA; PC, cells transfected with Cas9-NLS and BFP sgRNA. Data showed mean ± SD. n = 3 biological replicates. ns: non-significant;* P < 0.05; ** P < 0.01; **** P < 0.0001; two-tailed t -tests.
Article Snippet: As for the CD43 activation assay, 48 h after 4-OHT was added, live cells were collected and incubated with a
Techniques: Activity Assay, Activation Assay, Luciferase, Reporter Assay, Expressing, Sequencing, Comparison, Transfection, Two Tailed Test

Journal: Nucleic Acids Research
Article Title: Multimode drug inducible CRISPR/Cas9 devices for transcriptional activation and genome editing
doi: 10.1093/nar/gkx1222
Figure Lengend Snippet: Selective and titratable drug induction of HIT systems. ( A and B ) Dose dependent transcription activation induced by HIT-SunTag (A) and HIT2 (B) with different concentration of β-estradiol or 4OHT was examined using the luciferase reporter assay. ( C and D ) Activation of endogenous gene CD43 was examined using flow cytometry. Quantitative analyses of the percentage of CD43 positive cells (C) and median CD43 fluorescent intensities (D) were shown. ( E ) Dose dependent genome editing activities of HIT2 were examined using the FCR assay upon treatment with different concentration of β-estradiol or 4-OHT. Data showed mean ± SD. n = 3 biological replicates. ns: non-significant; * P < 0.05; ** P < 0.01; *** P < 0.001; **** P < 0.0001; two-tailed t -tests. Fold of activation by 4-OHT over the same concentration of β-estradiol was displayed.
Article Snippet: As for the CD43 activation assay, 48 h after 4-OHT was added, live cells were collected and incubated with a
Techniques: Activation Assay, Concentration Assay, Luciferase, Reporter Assay, Flow Cytometry, Two Tailed Test

Journal: Nucleic Acids Research
Article Title: Multimode drug inducible CRISPR/Cas9 devices for transcriptional activation and genome editing
doi: 10.1093/nar/gkx1222
Figure Lengend Snippet: Adaptation of HIT designs to SaCas9. ( A and B ) Drug inducible gene activation by NLS-dSaCas9–GCN4 in conjunction with scFv-2ER T2 -AD was examined in the luciferase reporter assay (A) and the endogenous CD43 activation assay (B). ( C ) Simultaneous genome editing and transcriptional activation by HIT2-SaCas9 were examined by the FCR activity and CD43 activation respectively. Cells transfected with the same amount of reporter construct while keeping the total amount of transfection constant were used as negative controls (NC). ISO represents cells stained with antibody isotype control. Data showed mean ± SD. n = 3 biological replicates. ns: non-significant;* P < 0.05; ** P < 0.01; *** P < 0.001; two-tailed t -tests.
Article Snippet: As for the CD43 activation assay, 48 h after 4-OHT was added, live cells were collected and incubated with a
Techniques: Activation Assay, Luciferase, Reporter Assay, Activity Assay, Transfection, Construct, Staining, Control, Two Tailed Test
Journal: bioRxiv
Article Title: Altered X-chromosome inactivation predisposes to autoimmune manifestations in mice
doi: 10.1101/2023.04.20.537662
Figure Lengend Snippet: a. Spleen weight of wild-type (WT) and Ftx KO females at 3-months, 1-year and 2-years of age. Median values are shown. ( t-test , * p -values < 0.05). Underneath, representative images of WT and Ftx KO spleens from 3-month, 1-year and 2-year-old females. b. Representative images of hematoxylin-eosin staining on sections of spleens from 1-year-old WT and Ftx KO females. Scale bar; 100 μm. c. Representative flow cytometry analysis of splenic myeloid dendritic cells (m-DC) in WT and Ftx KO 1-year-old females. On the right, percentages of splenic m-DC (CD11b + CD11c + ) and splenic plasmacytoid dendritic cells (p-DC) (CD11c + B220 + SiglecH + ) in leucocytes. Each triangle represents a mouse. Median values are shown. ( t-test , * p -values < 0.05). d. Representative flow cytometry analysis of spontaneously activated B cells (B220 + CD69 + ) (upper panels) or of spontaneously activated T cells (CD4 + CD69 + ) (lower panels) in spleen from 1-year-old WT and Ftx KO females. Percentages in leucocytes are shown on the graphs beneath. Each triangle represents a mouse. Median values are shown. ( t-test , * p -values < 0.05). e. IgG2a natural antibody levels in sera of 1-year- and 2-year-old WT or Ftx KO females measured by ELISA. Each triangle represents a mouse. Median values are shown. ( t-test , * p -values < 0.05). f. Representative flow cytometry analysis of (B220 + CD138 + ) plasma cells in the spleen of 1-year-old WT and Ftx KO females. Percentages in leucocytes are shown on the graphs beneath. Each triangle represents a mouse. Median values are shown. ( t-test , * p -values < 0.05). g. Representative flow cytometry analysis of (CD19 + B220 lo CD5 + ) natural antibody producing B1a in the peritoneal cavity (PerC) of 1-year-old WT and Ftx KO females. Percentages in leucocytes are shown on the graphs beneath. Each triangle represents a mouse. Median values are shown. ( t-test , * p -values < 0.05). h. Cytokines levels in the blood analysed with CBA assays on sera from 3-month-, 1-year-, or 2-year-old WT and Ftx KO females. Each triangle represents a mouse. Median values are shown. ( t-test , * p -values < 0.05). i. Representative flow cytometry analysis of monocyte populations including non-classical (CD11b hi CD43 lo Ly6C + ) scavenger monocytes in the spleen of 1-year-old WT and Ftx KO females. Percentages in leucocytes are shown on the graphs beneath. Each triangle represents a mouse. Median values are shown. ( t-test , * p -values < 0.05).
Article Snippet: Bone marrow, spleen, blood and peritoneal cavity cells were stained using the following antibodies: CD3 PerCP-Vio770 (130-119-656, Miltenyi Biotec), CD4-APC (130-123-207, Miltenyi Biotec), CD5-APC-Vio770 (130-120-165, Miltenyi Biotec), CD8-FITC (130-118-468, Miltenyi Biotec), CD11b APC (553312, BD Pharmingen), CD11c PE-Vio770 (130-110-840, Miltenyi Biotec), CD19-FITC (557398, BD Pharmingen), CD21-APC-Vio770 (130-111-733, Miltenyi Biotec), CD23-PE-Vio770 (130-118-764, Miltenyi Biotec), CD38-PE (130-123-571, Miltenyi Biotec),
Techniques: Staining, Flow Cytometry, Enzyme-linked Immunosorbent Assay, Clinical Proteomics
Journal: PLOS ONE
Article Title: B cell phenotypes and maturation states in cows naturally infected with Mycobacterium avium subsp. Paratuberculosis
doi: 10.1371/journal.pone.0278313
Figure Lengend Snippet: B cells were partitioned into B-1a, B-1b and B-2 subpopulations using BAQ44A, BAQ155A, and CD21 as primary B cell markers, followed by CD11b, and CD5 as subset markers (A), and using sIgM as primary B cell marker, followed by CD11b, CD20, CD27, CD43, and CD5 as subset markers (B).
Article Snippet:
Techniques: Marker

Journal: PLOS ONE
Article Title: B cell phenotypes and maturation states in cows naturally infected with Mycobacterium avium subsp. Paratuberculosis
doi: 10.1371/journal.pone.0278313
Figure Lengend Snippet: Primary and secondary antibodies used to discriminate B cell subpopulations.
Article Snippet:
Techniques: Marker

Journal: PLOS ONE
Article Title: B cell phenotypes and maturation states in cows naturally infected with Mycobacterium avium subsp. Paratuberculosis
doi: 10.1371/journal.pone.0278313
Figure Lengend Snippet: B cells were further partitioned using CD11b, CD20, CD27, CD43, and CD5 antibodies for B cell subpopulations within PBMCs that were freshly isolated (A); or incubated with a whole cell sonicate (MPS; 10 μg/ml) of M . avium subsp. paratuberculosis (B) for 6 days in vitro.
Article Snippet:
Techniques: Isolation, Incubation, In Vitro
Journal: Immunity
Article Title: Pro-inflammatory Aorta-Associated Macrophages Are Involved in Embryonic Development of Hematopoietic Stem Cells
doi: 10.1016/j.immuni.2019.05.003
Figure Lengend Snippet:
Article Snippet: Anti-Mouse CD43 (clone S11)-146Nd ,
Techniques: Purification, Recombinant, Software, Control, High Throughput Screening Assay, Sequencing